Journal of
Clinical & Medical Surgery
Clinical & Medical Surgery
www.jclinmedsurgery.com
ISSN 2833-5465
Open Access
Volume 5
Open Access
Volume 5
Ying Zhang1; Xueqiong Ruan1; Yan Wu1; Zonglang Zhou2*
*Corresponding Author: Zonglang Zhou
Department of Respiratory and Critical Care Medicine, the Fourth Affiliated Hospital of School of Medicine, and International School of Medicine, International Institutes of Medicine, Zhejiang University, Yiwu 322000, China.
Email: 13456213819@163.com
Article Info
Received: Jun 24, 2025
Accepted: Aug 06, 2025
Published: Aug 13, 2025
Archived: www.jclinmedsurgery.com
Copyright: © Zhou Z (2025).
Abstract...
Background: The pathophysiologic mechanisms and etiology of sarcopenia are still incompletely understood, Inflammation plays an important role in the development of sarcopenia. The Neutrophil Percentage-to-Albumin Ratio (NPAR) represents an innovative indicator that reflects inflammatory response and immune condition. The present investigation seeks to examine the correlation between NPAR and sarcopenia, providing novel insights into sarcopenia prevention and risk assessment.
Methods: We analyzed 8851 patients with sarcopenia from the National Health and Nutrition Examination Survey (NHANES) database for the period 2011-2018. We used multivariate weighted logistic regression analysis, smoothed curve fitting, and subgroup analysis to explore the association between NPAR and sarcopenia.
Results: We found a significant positive correlation between the NPAR index and the risk of sarcopenia. Across all models, a rise in the NPAR index was notably linked to an elevated sarcopenia risk (P<0.0001). In the fully adjusted model, this connection remained robust, with an OR of 1.29 (P<0.0001). The correlation was particularly pronounced in men, individuals who were divorced, separated, or widowed, and those with emphysema. The smooth curve fitting analysis indicated a linear relationship between NPAR and sarcopenia prevalence.
Conclusions: The findings underscore a notable correlation between NPAR and sarcopenia prevalence, highlighting its utility as an innovative indicator for sarcopenia risk assessment and early detection.
Keywords: Splenic artery pseudoaneurysm; Small intestine.
Citation: Zhang Y, Ruan X, Wu Y, Zhou Z. Association between neutrophil percentage-to-albumin ratio and sarcopenia: A cross-sectional study. J Clin Med Surgery. 2025; 5(2): 1202.
Background
Sarcopenia is described as “a progressive and generalized skeletal muscle disorder characterized by the accelerated loss of skeletal muscle mass and function” [1]. The occurrence of sarcopenia demonstrates substantial variation per the classification criteria and cutoff points used, with narrative reviews reporting a range from 0.2% to 86.5% and meta-analyses estimating a prevalence between 10% and 27% [2]. As worldwide demographic aging progresses, the occurrence of sarcopenia keeps rising, and projections suggest that the number of affected individuals will reach 500 million by 2050 [3]. Sarcopenia compromises physical function and mobility, heightening the risk of falls, frailty, disability, and hospitalization. It is strongly associated with prolonged hospital stays and increased premature mortality [4,5], posing a significant global health challenge and imposing a substantial economic burden [6].
Despite extensive research, the pathophysiological mechanisms and etiology of sarcopenia remain incompletely understood [7,8]. Current diagnostic approaches primarily involve imaging protocols like Computed Tomography (CT) and Dualenergy X-ray Absorptiometry (DXA), alongside physiological assessments, including grip strength and gait speed [9]. However, these methods are costly and lack portability, limiting their feasibility for routine screening. Identifying a direct, reliable, and cost-effective biomarker for early detection and risk assessment is therefore of paramount importance.
Accumulating evidence indicates that inflammatory processes serve as a crucial factor in the development of sarcopenia, leading to impaired skeletal muscle function and structural deterioration [10,11]. Meta-analyses have demonstrated elevated levels of inflammatory biomarkers in individuals with muscle loss [12]. The Neutrophil Percentage-to-Albumin Ratio (NPAR) represents an innovative indicator that reflects inflammatory response and immune condition [13]. This measurement combines two essential parameters: neutrophil percentage, indicating systemic inflammatory status, and albumin, reflecting nutritional levels. Current research indicates that NPAR functions as an efficient and economical marker for detecting individuals susceptible to diabetes mellitus, cardiovascular disease, and chronic kidney disease [13-15]. Nevertheless, its connection with sarcopenia remains undetermined. The present investigation seeks to examine the correlation between NPAR and sarcopenia among participants from the United States (US) National Health and Nutrition Examination Survey (NHANES), providing novel insights into sarcopenia prevention and risk assessment.
Methods
Study population
This investigation employed information from the NHANES, a cross-sectional survey representing the nation, established to assess nutritional conditions and health profiles of the U.S. population via structured conversations, medical evaluations, and clinical tests. NHANES refreshes its dataset on a biennial basis. The research protocol obtained authorization from the National Center for Health Statistics Research Ethics Review Board, with participants granting documented consent. Detailed information concerning the NHANES methodology and data accessibility can be found at https://www.cdc.gov/nchs/nhanes/.
Data collected during eight sequential years was obtained, encompassing the NHANES cycles from 2011–2012, 2013– 2014, 2015–2016, and 2017–2018. The inclusion criteria specified participants aged ≥20 years from the 2011–2018 NHANES datasets, totaling 39,156 individuals. Exclusion criteria included the absence of DXA and Body Mass Index (BMI) data, which precluded sarcopenia classification. Additionally, participants lacking neutrophil percentage and albumin data were excluded due to the inability to calculate NPAR. Further exclusions were applied to those with incomplete covariate data, yielding an ultimate study population of 8,851 subjects. The systematic selection procedure appears in Figure 1.
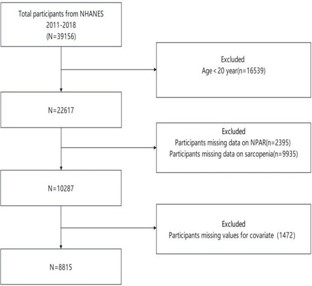
Figure 1: Electrocardiogram suggesting possible right ventricle strain.
Definition of the NPAR and sarcopenia
White blood cell counts were measured using an automated hematology analyzer (Coulter1 DxH 800), with neutrophil percentage determined via the Coulter VCS system. NPAR, serving as the exposure variable, was computed utilizing the following formula: NPAR=Neutrophil Percentage (%)/albumin (g/dL).
The lean mass of arms and legs, denoted as Appendicular Skeletal Muscle mass (ASM), underwent evaluation through DXA scanning. Nevertheless, DXA assessments excluded participants who met specific criteria: pregnancy status, height above 192.5 cm, or body weight exceeding 136.4 kg. The identification of sarcopenia relied on the sarcopenia index, derived by calculating ASM relative to BMI, utilizing diagnostic cutoff values of <0.512 in females and <0.789 in males [16].
Assessment of covariates
The covariates encompassed age, sex, and race/ethnicity, split into Mexican American, non-Hispanic White, non-Hispanic Black, and others. Smoking status categories derived from self-reported information: never smokers (consumed <100 cigarettes throughout life and not currently smoking), former smokers (consumed >100 cigarettes throughout life but ceased smoking), and current smokers (consumed ≥100 cigarettes throughout life and presently smoking). Alcohol use was classified into never (lifetime consumption of <12 drinks), former (prior intake of >12 drinks but discontinued), and current (≥12 drinks annually). Education level was divided into three categories: below high school, high school diploma, and above high school. Family income classifications utilized the poverty income ratio: low (<1.3), medium (≥1.3 to <3.5), and high (≥3.5). BMI categories included ≤25 kg/m2, 25-29.9 kg/m2, and ≥30 kg/m2. Marital status comprised married/living with a partner, never married, and widowed/divorced/separated. Cardiovascular Disease (CVD) identification relied on standardized medical questionnaires and self-reported physician diagnoses, with affirmative responses to coronary heart disease, congestive heart failure, heart attack, angina, or stroke indicating CVD presence [17]. Diabetes diagnosis stemmed from: (1) self-reported diabetes history, (2) antidiabetic medication usage, or (3) hemoglobin A1c (HbA1c) level ≥6.5% [18]. Additional medical conditions evaluated through self-reported history included hypertension, asthma, emphysema, chronic bronchitis, and cancer [19]. Laboratory measurements incorporated aspartate Aminotransferase (AST), Alanine aminotransferase (ALT), Triglycerides (TG), total Cholesterol (Chol), Glycosylated hemoglobin (HbA1c), White Blood Cell Count (WBC), Platelet Count (PLT), Lymphocyte count (Lym), and Neutrophil count (Neu). Sedentary behavior assessment utilized self-reported daily sitting time, including activities at school, home, during transportation, and leisure pursuits (e.g., reading, television viewing, computer use). Previous research guided the dichotomization of daily sitting time into <8 hours and ≥8 hours daily [20]. Physical activity intensity levels are distinguished between vigorous (demanding substantial physical effort causing marked increases in breathing or heart rate) and moderate (requiring moderate effort with slight increases in breathing or heart rate).
Statistical analysis
Statistical analyses were conducted utilizing R software (version 4.3.1), with P<0.05 indicating statistical significance. NHANES employs a complex sampling design, incorporating sample weights to ensure national representativeness. Data were adjusted using the NHANES-recommended sample weight computation formula: Weights = WTMEC2YR/4. Within the weighted baseline table, numerical variables appear as means accompanied by standard deviations, while categorical data are shown as percentages. The Kruskal-Wallis H test evaluated differences in numerical variables, while chi-squared tests analyzed categorical variables. The relationship between NPAR and sarcopenia underwent examination through weighted multivariate logistic regression analyses, presenting outcomes as Odds Ratios (ORs) and 95% Confidence Intervals (CIs). The analysis encompassed three models: Model 1 was unadjusted, Model 2 adjusted for sex, age, race, marital status, education level, and PIR, while Model 3 included all covariates. NPAR was analyzed as both a continuous and categorical variable. Subgroup analyses were conducted to examine the effects of sex, age, race, BMI, marital status, education level, smoking status, alcohol consumption, PIR, diabetes, hypertension, asthma, emphysema, chronic bronchitis, cancer, cardiovascular disease, vigorous work activity, moderate work activity, and sedentary behavior. The association between NPAR and sarcopenia was further explored using a weighted Restricted Cubic Spline (RCS) analysis, with an evaluation of potential threshold effects.
Table 1: Baseline characteristics of participants from NHANES (2011-2018).
| Characteristic | All (n = 8851) | Non- sarcopenia (n=8086) | Sarcopenia (n=765) | p-value |
|---|---|---|---|---|
| NPAR | 13.42±2.42 | 13.34±2.41 | 14.26±2.43 | <0.001 |
| Gender | 0.938 | |||
| Male | 4420(49.94%) | 4039(49.95%) | 381(49.80%) | |
| Female | 4431(50.06%) | 4047(50.05%) | 384(50.20%) | |
| Age | 39.17±11.54 | 38.75±11.47 | 43.64±11.28 | <0.001 |
| Race | <0.001 | |||
| Mexican American | 1295(14.63%) | 1036(12.81%) | 259(33.86%) | |
| Non-Hispanic White | 3277(37.02%) | 3060(37.84%) | 217(28.37%) | |
| Non-Hispanic Black | 1787(20.19%) | 1740(21.52%) | 47(6.14%) | |
| Other | 2492(28.16%) | 2250(27.83%) | 242(31.63%) | |
| Body mass index | <0.001 | |||
| < 25 | 2772(31.32%) | 2709(33.50%) | 63(8.24%) | |
| [25,30) | 2806(31.70%) | 2626(32.48%) | 180(23.53%) | |
| ≥ 30 | 3273(36.98%) | 2751(34.02%) | 522(68.24%) | |
| Marital status | ||||
| Married/Living with a partner | 5291(59.78%) | 4805(59.42%) | 486(63.53%) | <0.001 |
| Widowed/Divorced/Separated/ | 1238(13.99%) | 1112(13.75%) | 126(16.47%) | |
| Never married | 2322(26.23%) | 2169(26.82%) | 153(20.00%) | |
| Education level | <0.001 | |||
| Less than high school | 1461(16.51%) | 1239(15.32%) | 222(29.02%) | |
| High school diploma | 1936(21.87%) | 1733(21.43%) | 203(26.54%) | |
| More than high school | 5454(61.62%) | 5114(63.25%) | 340(44.44%) | |
| Smoked status | ||||
| Never | 5340(60.33%) | 4858(60.08%) | 482(63.01%) | <0.001 |
| Fermer | 1516(17.13%) | 1366(16.89%) | 150(19.61%) | |
| Current | 1995(22.54%) | 1862(23.03%) | 133(17.39%) | |
| Drinking status | <0.001 | |||
| Never | 1867(21.09%) | 1635(20.22%) | 232(30.33%) | |
| Fermer | 718(8.11%) | 626(7.74%) | 92(12.03%) | |
| Current | 6266(70.79%) | 5825(72.04%) | 441(57.65%) | |
| Ratio of family income to poverty | <0.001 | |||
| <1.3 | 2810(31.75%) | 2498(30.89%) | 312(40.78%) | |
| [1.3–3.5) | 3219(36.37%) | 2939(36.35%) | 280(36.60%) | |
| ≥ 3.5 | 2822(31.88%) | 2649(32.76%) | 173(22.61%) | |
| Vigorous work activity | 0.233 | |||
| NO | 6681(75.48%) | 6090(75.32%) | 591(77.25%) | |
| YES | 2170(24.52%) | 1996(24.68%) | 174(22.75%) | |
| Moderate work activity | 0.002 | |||
| NO | 5175(58.47%) | 4687(57.96%) | 488(63.79%) | |
| YES | 3676(41.53%) | 3399(42.04%) | 277(36.21%) | |
| Sedentary behavior | 0.011 | |||
| Mild | 5512(62.28%) | 5003(61.87%) | 509(66.54%) | |
| Severe | 3339(37.72%) | 3083(38.13%) | 256(33.46%) | |
| Hypertension | <0.001 | |||
| NO | 6780(76.60%) | 6252(77.32%) | 528(69.02%) | |
| YES | 2071(23.40%) | 1834(22.68%) | 237(30.98%) | |
| Diabetes | <0.001 | |||
| NO | 7976(90.11%) | 7370(91.15%) | 606(79.22%) | |
| YES | 875(9.89%) | 716(8.85%) | 159(20.78%) | |
| Asthma | 0.127 | |||
| NO | 7459(84.27%) | 6829(84.45%) | 630(82.35%) | |
| YES | 1392(15.73%) | 1257(15.55%) | 135(17.65%) | |
| Emphysema | <0.001 | |||
| NO | 8785(99.25%) | 8037(99.39%) | 748(97.78%) | |
| YES | 66(0.75%) | 49(0.61%) | 17(2.22%) | |
| Chronic bronchitis | 0.003 | |||
| NO | 8432(95.27%) | 7720(95.47%) | 712(93.07%) | |
| YES | 419(4.73%) | 366(4.53%) | 53(6.93%) | |
| Cancer | 0.013 | |||
| NO | 8520(96.26%) | 7796(96.41%) | 724(94.64%) | |
| YES | 331(3.74%) | 290(3.59%) | 41(5.36%) | |
| Cardiovascular disease | <0.001 | |||
| NO | 8513(96.18%) | 7806(96.54%) | 707(92.42%) | |
| YES | 338(3.82%) | 280(3.46%) | 58(7.58%) | |
| White blood cell | 7.29±2.15 | 7.22±2.13 | 8.08±2.24 | <0.001 |
| Neutrophils | 4.25±1.67 | 4.19±1.65 | 4.84±1.77 | <0.001 |
| Lymphocyte | 2.24±0.71 | 2.23±0.71 | 2.39±0.73 | <0.001 |
| Platelet | 244.27±59.61 | 243.06±59.00 | 257.07±64.45 | <0.001 |
| Hemoglobin | 14.14±1.53 | 14.13±1.53 | 14.21±1.60 | 0.122 |
| Cholesterol | 191.17±40.06 | 190.51±39.90 | 198.08±41.14 | <0.001 |
| Triglycerides | 151.70±137.58 | 148.80±136.66 | 182.31±143.49 | <0.001 |
| Aspartate aminotransferase | 25.01±15.48 | 24.90±15.42 | 26.18±16.11 | 0.002 |
| Alanine aminotransferase | 26.05±20.60 | 24.90±15.42 | 30.39±24.41 | <0.001 |
Results
Baseline characteristics: The investigation encompassed 8,815 participants, among whom 756 were diagnosed with sarcopenia, yielding a prevalence of 8.57%. The NPAR was markedly elevated in the sarcopenia group compared to the nonsarcopenia group. Additionally, individuals with sarcopenia were older, had higher BMI values, and exhibited an increased prevalence of hypertension, diabetes, chronic bronchitis, cardiovascular disease, and cancer. Nevertheless, these individuals demonstrated diminished educational attainment and income. Statistically significant differences were also observed in race, marital status, smoking, and drinking habits, as well as in laboratory parameters, including white blood cell count, neutrophil count, lymphocyte count, platelet count, total cholesterol, triglycerides, aspartate aminotransferase, alanine aminotransferase. Baseline characteristics are presented in Table 1.
Associations
Links between the NPAR and sarcopenia
Table 2 reveals a notable positive correlation between the NPAR index and sarcopenia risk, with an increasing NPAR index corresponding to a higher likelihood of sarcopenia. Across all models, a rise in the NPAR index was notably linked to an elevated sarcopenia risk (P<0.0001). In the fully adjusted model (Model 3), this connection remained robust, with an OR of 1.29 (P<0.0001). Upon analyzing NPAR as a categorical variable by quartiles, sarcopenia occurrence remained markedly elevated in the highest quartile versus the lowest across each model. In Model 3, individuals in the fourth quartile exhibited a 3.37-fold higher risk of sarcopenia versus those in the lowest quartile. Additionally, the test for trend was statistically significant in all models (P<0.0001), reinforcing the dose-response link between NPAR and sarcopenia risk.
Table 2: Associations between the NPAR index and sarcopenia risk.
| NPAR | OR (95%CI) P-value | ||
|---|---|---|---|
| Model 1 | Model 2 | Model 3 | |
| Per 1 unit increase Quartile | 1.18 (1.12, 1.24) <0.0001 | 1.17 (1.11, 1.23) <0.0001 | 1.29 (1.16, 1.43) <0.0001 |
| Q1 | Ref. | Ref. | Ref. |
| Q2 | 1.37 (0.95, 1.98) 0.0975 | 1.23 (0.85, 1.78) 0.2678 | 1.36 (0.91, 2.04) 0.1440 |
| Q3 | 1.51 (1.06, 2.15) 0.0248 | 1.35 (0.95, 1.92) 0.1007 | 1.60 (1.03, 2.51) 0.0468 |
| Q4 | 2.94 (2 .07, 4.17) <0.0001 | 2.59 (1.85, 3.64) <0.0001 | 3.37 (1.99, 5.71) 0.0001 |
| P-trend | 1.43 (1.28, 1.59) <0.0001 | 1. 38 (1.24, 1.54) <0.0001 | 1.48 (1.26, 1.74) <0.0001 |
Notably, NPAR was most strongly associated with sarcopenia risk in the higher quartiles (Q3 and Q4). The risk of sarcopenia increased progressively with rising NPAR, and this association remained significant following adjustment for possible confounders. Each 1-unit increase in NPAR was positively correlated with sarcopenia risk, suggesting that NPAR might function as a predictive indicator for sarcopenia.
Figure 2 further illustrates the linear relationship between NPAR and sarcopenia prevalence, highlighting a pronounced risk increase as NPAR exceeds a specific threshold. These results suggest that NPAR may not only function as a predictive marker for sarcopenia but also reflect underlying chronic inflammation or other pathological mechanisms contributing to sarcopenia progression in individuals with elevated NPAR values.
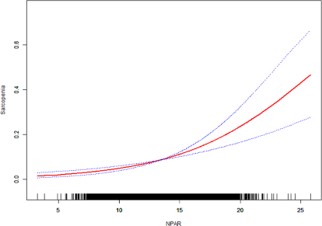
Figure 2: : Link between the neutrophil percentage-to-albumin ratio (NPAR) and sarcopenia, with covariates adjusted according to Model 3.
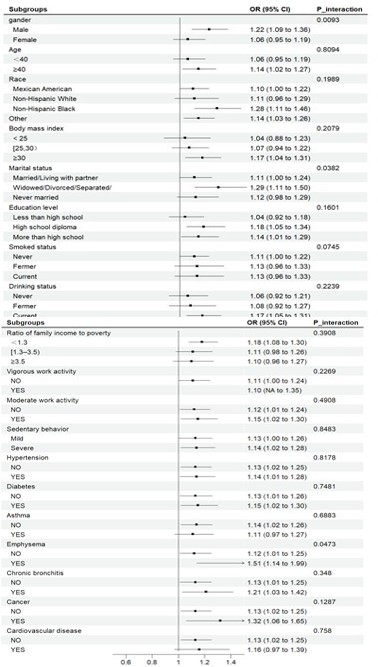
Figure 3 & 4: The link between the Neutrophil Percentage-toAlbumin Ratio (NPAR) and sarcopenia, modeled utilizing restricted cubic spline regression.
Model 1: No covariate adjustments;
Model 2: Adjusted for sex, age, race, education level, poverty income ratio (PIR), and marital status;
Model 3: Fully adjusted for all variables, including sex, age, race, education level, PIR, marital status, BMI, smoking status, alcohol consumption, vigorous work activity, hypertension, diabetes, asthma, emphysema, chronic bronchitis, cancer, cardiovascular disease, moderate work activity, sedentary behavior, white blood cell count, neutrophil count, lymphocyte count, platelet count, hemoglobin, total cholesterol, triglycerides, aspartate aminotransferase, and alanine aminotransferase.
Subgroup investigation of the link between the NPAR and sarcopenia
Subgroup analyses were executed to evaluate the correlation between NPAR and sarcopenia across various clinical, lifestyle, and demographic factors. Interaction analysis revealed statistically significant differences in the link between NPAR and sarcopenia based on sex, marital status, and emphysema (P<0.05). Nevertheless, additional parameters failed to substantially alter the favorable association between NPAR and sarcopenia (P>0.05) (Figures 3 & 4).
Discussion
The etiology of sarcopenia is multifaceted, involving diverse biological processes [1]. Among these, chronic low-grade inflammation is regarded as a key pathogenic driver, with inflammatory mediators contributing directly or indirectly to sarcopenia progression through various pathophysiological mechanisms [21,22]. Neutrophils function as essential mediators in this mechanism by producing pro-inflammatory cytokines, such as Interleukin-6 (IL-6) and Tumor Necrosis Factor-Alpha (TNF-α) [23]. Substantial research demonstrates the connection between increased IL-6 and TNF-α concentrations and sarcopenia. These cytokines trigger Nuclear Factor-kappa B (NF-κB), a vital modulator of muscle protein catabolism, thereby promoting muscle degradation and accelerating sarcopenia onset [2426]. Beyond their direct effects on skeletal muscle, TNF-α, and IL-6 further amplify systemic inflammation by modulating immune cell activity, particularly macrophages and T cells, which, in turn, release additional inflammatory mediators, perpetuating a positive feedback loop of muscle damage27. Investigations by Rong et al. and Tuttle et al. confirmed that elevated IL-6 and TNF-α levels correlate with reduced muscle strength and mass [12,28]. Neutrophils exacerbate muscle damage not only by producing cytokines but also through the release of oxidative enzymes, such as Myeloperoxidase (MPO), Reactive Oxygen Species (ROS), and Neutrophil Extracellular Traps (NETs), as demonstrated by Torres-Ruiz et al [29]. Additionally, Guo et al. identified a significant association between neutrophilderived inflammatory markers—such as the Systemic Immuneinflammatory Index (SII) and Neutrophil-to-Lymphocyte Ratio (NLR)—and an increased risk of sarcopenia [30]. Clinical trials evaluating anti-inflammatory interventions for sarcopenia have demonstrated enhancements in muscular performance and functionality, lending additional evidence to the significance of chronic inflammation in sarcopenic development [31,32]. These findings underscore the intricate link between neutrophils and sarcopenia, implicating multiple pathological pathways, including chronic inflammation, direct muscle injury, and immune dysregulation. Furthermore, albumin, a well-established nutritional biomarker, serves a crucial function in evaluating nutritional status, a key risk factor for sarcopenia [33]. Albumin is a critical biomarker for evaluating nutritional status, with lower levels associated with impaired wound healing, immune dysfunction, and reductions in lean mass [34]. Additionally, albumin possesses antioxidant properties, and protein deficiency demonstrates associations with heightened susceptibility to oxidative muscle damage, accelerating skeletal muscle degradation [35-37]. Studies have also indicated that albumin modulates the Phosphatidylinositol 3-Kinase (PI3K) pathway and regulates serum testosterone levels, both of which influence muscle mass and contribute to muscle loss [38,39]. A growing body of evidence supports the association between albumin levels and sarcopenia [40,41]. The interplay between chronic inflammation and nutritional status is a key contributor to sarcopenia progression. Neutrophil-mediated inflammation accelerates albumin depletion by increasing protein catabolism, while hypoalbuminemia compromises anti-inflammatory defenses, further exacerbating the inflammatory response. This bidirectional interaction disrupts muscle protein synthesis while promoting catabolism, ultimately driving sarcopenia progression. Recently, NPAR has emerged as a novel biomarker that integrates systemic inflammation and nutritional status. In contrast to single measurements of albumin or neutrophil percentage, NPAR demonstrates an enhanced amplification effect, yielding a more thorough indicator of disease risk. Although its predictive capabilities have been documented across multiple pathological states [42-47], prior research has not examined the connection between NPAR and sarcopenia. The present investigation analyzed the link between NPAR and sarcopenia occurrence, identifying a substantial positive relationship between heightened NPAR and sarcopenia susceptibility. These observations indicate that NPAR could function as a viable biomarker for sarcopenia screening and risk evaluation in clinical settings.
The development of sarcopenia is strongly influenced by lifestyle factors, chronic diseases, and sociodemographic characteristics. In this study, individuals with sarcopenia were older, had elevated BMI values, and increased rates of hypertension, diabetes, chronic bronchitis, cardiovascular disease, and cancer—findings consistent with previous research [1]. Low socioeconomic status, characterized by limited household income and lower educational attainment, has emerged as a notable predictive indicator for sarcopenia, warranting urgent public health attention. A UK aging study reported that individuals with low education levels and subjective social disadvantage faced a twofold higher risk of sarcopenia compared to their higher-status counterparts, independent of BMI and chronic disease burden [48]. Similarly, our findings align with other studies indicating that low-income populations are more vulnerable to sarcopenia, potentially due to reduced access to healthcare, nutritious food, and opportunities for physical activity [49,50]. Future interventions should prioritize individuals with lower socioeconomic status to mitigate sarcopenia risk. This study also identified a correlation between sedentary behavior and sarcopenia, supporting previous findings by Yihan Mo that prolonged sedentary time is a significant risk factor for muscle deterioration [51]. Interestingly, while strenuous work activity showed no significant association with sarcopenia risk, moderate work activity was statistically significant, highlighting the potential benefits of moderate-intensity physical activity in sarcopenia prevention. These findings provide valuable insights for developing targeted exercise strategies to mitigate sarcopenia progression. The association between NPAR and sarcopenia remained stable across different subgroups.
However, the correlation was particularly pronounced in men, individuals who were divorced, separated, or widowed, and those with emphysema. Variability in sarcopenia prevalence between sexes could stem from variations in diagnostic standards, study population age distributions, regional factors, and assessment methodologies. A meta-analysis encompassing 263 studies found that sarcopenia prevalence was higher in men than in women when applying European diagnostic criteria and muscle mass-based definitions, a trend consistent with our findings [2]. This sex difference may be linked to the role of testosterone in muscle metabolism, as testosterone is a key hormone for muscle growth. Age-related testosterone decline in men contributes significantly to muscle loss and decreased muscle mass [52]. Insulin-like Growth Factor-1 (IGF-1) serves a pivotal function in muscle metabolism, with its levels declining significantly with age in men while remaining relatively stable in women, contributing to a higher rate of muscle loss in men [53]. Marital status also appears to influence sarcopenia risk, as divorced, separated, and widowed individuals often experience reduced family support. A study on older Chinese adults suggested that family support may affect muscle mass through mechanisms related to mental health, metabolic regulation, and dietary habits, although its protective role against sarcopenia requires further investigation [54]. Accumulating evidence indicates that older adults living with spouses or family members have a lower risk of sarcopenia, benefiting from greater caregiving support, improved psychological well-being, and better nutritional intake—all of which act as protective factors [55]. Gao Q and colleagues recently reported that individuals with marital instability face a 57% increased risk of sarcopenia, identifying marital status as an independent risk factor [56]. This finding may explain the stronger association between NPAR and sarcopenia observed in divorced, separated, and widowed individuals. Targeted prevention strategies and enhanced education on marital relationships may help mitigate sarcopenia risk in this population. A systematic review and meta-analysis of sarcopenia in patients with Chronic Obstructive Pulmonary Disease (COPD) revealed that sarcopenia prevalence in patients with COPD is approximately twice that of the general elderly population. Sarcopenia in COPD has been linked to increased dyspnea, higher exacerbation frequency, and greater muscle weakness [57]. Hospitalization further accelerates physical decline and muscle atrophy, compounding sarcopenia progression. This interplay may contribute to the strong association observed between NPAR and sarcopenia in emphysema. Early identification of skeletal sarcopenia could facilitate targeted preventive strategies in patients with COPD, potentially reducing their healthcare burden [58].
This study is the first to comprehensively analyze the relationship between NPAR and sarcopenia incidence. However, certain limitations should be acknowledged. As an observational cross-sectional investigation, this evaluation cannot definitively establish the causative link between NPAR and sarcopenia, necessitating further prospective research for validation. Additionally, neutrophil percentage and albumin levels were assessed at a single time point, limiting the ability to capture dynamic fluctuations and their potential impact on sarcopenia progression.
Conclusions
Despite these limitations, the findings underscore a notable correlation between NPAR and sarcopenia prevalence, highlighting its utility as an innovative indicator for sarcopenia risk assessment and early detection.
Declarations
Author contributions: Conceptualization, Ying Zhang and Zonglang Zhou; Data curation, Ying Zhang and Xueqiong Ruan; Funding acquisition, Ying Zhang; Investigation, Xueqiong Ruan; Project administration, Ying Zhang; Software, Ying Zhang and Yan Wu; Writing – original draft, Ying Zhang and Zonglang Zhou; Writing – review & editing, Ying Zhang and Zonglang Zhou.
Funding: This study was funded by the Medical Science and Technology Project of Zhejiang Province, China (2024KY1183).
Data availability: The raw data for this article are publicly available in the NHANES repository http://www.cdc.gov/nchs/nhanes/).
Ethics approval and consent to participate: This study was approved by National Center for Health Statistics Ethics Review Board and all participants were required to provide written informed consent.
Competing interests: The authors declare no competing interests.
References
- Cruz-Jentoft AJ, Sayer AA. Sarcopenia. The Lancet. 2019; 393: 2636-2646.
- Petermann-Rocha F, Balntzi V, Gray SR, et al. Global prevalence of sarcopenia and severe sarcopenia: a systematic review and meta-analysis. J Cachexia Sarcopenia Muscle. 2022; 13: 86-99.
- Sayer AA, Cooper R, Arai H, et al. Sarcopenia. Nat Rev Dis Primers. 2024; 10: 68.
- Zanker J, Sim M, Anderson K, et al. Consensus guidelines for sarcopenia prevention, diagnosis, and management in Australia and New Zealand. J Cachexia Sarcopenia Muscle. 2023; 14: 142156.
- Xu J, Wan CS, Ktoris K, Reijnierse EM, Maier AB. Sarcopenia is associated with mortality in adults: a systematic review and metaanalysis. Gerontology. 2022; 68: 361-376.
- Janssen I, Shepard DS, Katzmarzyk PT, Roubenoff R. The healthcare costs of sarcopenia in the United States. J Am Geriatr Soc. 2004; 52: 80-85.
- Picca A, Lozanoska-Ochser B, Calvani R, Coelho-Júnior HJ, Leewenburgh C, Marzetti E. Inflammatory, mitochondrial, and senescence-related markers: underlying biological pathways of muscle aging and new therapeutic targets. Exp Gerontol. 2023; 178: 112204.
- Massironi S, Viganò C, Palermo A, et al. Inflammation and malnutrition in inflammatory bowel disease. Lancet Gastroenterol Hepatol. 2023; 8: 579-590.
- Sayer AA, Cruz-Jentoft A. Sarcopenia definition, diagnosis and treatment: consensus is growing. Age Ageing. 2022; 51: afac220.
- Chhetri JK, De Souto Barreto P, Fougère B, Rolland Y, Vellas B, Cesari M. Chronic inflammation and sarcopenia: a regenerative cell therapy perspective. Exp Gerontol. 2018; 103: 115-123.
- Shi L, Zhang L, Zhang D, Chen Z. Association between systemic immune-inflammation index and low muscle mass in US adults: a cross-sectional study. BMC Public Health. 2023; 23: 1416.
- Tuttle CSL, Thang LAN, Maier AB. Markers of inflammation and their association with muscle strength and mass: a systematic review and meta-analysis. Ageing Res Rev. 2020; 64: 101185.
- He X, Dai F, Zhang X, Pan J. The neutrophil percentage-to-albumin ratio is related to the occurrence of diabetic retinopathy. Clin Lab Anal. 2022; 36: e24334.
- Wang R, Tao W, Chen H, Ma T, Cheng X. Investigating nonlinear associations between neutrophil percentage to albumin ratio and cardiovascular disease: a nationally representative crosssectional study. Sci Rep. 2024; 14: 23632.
- Li J, Xiang T, Chen X, Fu P. Neutrophil-percentage-to-albumin ratio is associated with chronic kidney disease: evidence from NHANES 2009–2018. PLoS One. 2024; 19: e0307466.
- Yang J, Liu C, Zhao S, et al. The association between the triglyceride-glucose index and sarcopenia: data from the NHANES 2011–2018. Lipids Health Dis. 2024; 23: 219.
- Zeng QY, Qin Y, Shi Y, et al. Systemic immune-inflammation index and all-cause and cause-specific mortality in sarcopenia: a study from National Health and Nutrition Examination Survey 19992018. Front Immunol. 2024; 15: 1376544.
- Shi L, Jia F. Association between antidepressant use and liver fibrosis in patients with type 2 diabetes: a population based study. Diabetol Metab Syndr. 2023; 15: 45.
- Mossadeghi B, Caixeta R, Ondarsuhu D, et al. Multimorbidity and social determinants of health in the US prior to the COVID-19 pandemic and implications for health outcomes: a crosssectional analysis based on NHANES 2017–2018. BMC Public Health. 2023; 23: 887.
- He J, Zhang C, Yang L. Association between sedentary behavior, physical activity, and osteoarthritis: results from NHANES 2007–2020 and Mendelian randomization analysis. Front Public Health. 2025; 12: 1454185.
- Schaap LA, Pluijm SMF, Deeg DJH, Visser M. Inflammatory markers and loss of muscle mass (sarcopenia) and strength. Am J Med. 2006; 119: 526.e9-526.e17.
- Zhou X, Wu X, Zhang D. Prevalence of sarcopenia and associated dietary factors among older Chinese adults. Saudi Med J. 2023; 44: 1180-1181.
- Aroca-Crevillén A, Vicanolo T, Ovadia S, Hidalgo A. Neutrophils in physiology and pathology. Annu Rev Pathol. 2024; 19: 227-259.
- Vaughan SK, Sutherland NM, Valdez G. Attenuating cholinergic transmission increases the number of satellite cells and preserves muscle mass in old age. Front Aging Neurosci. 2019; 11: 262.
- Poursadeghfard M, Foroughi AA, Karamimagham S. Thymolipoma-associated myasthenia gravis with high titer of anti-MuSKAb: a case report.
- Ma JF, Sanchez BJ, Hall DT, et al. STAT3 promotes IFNγ/TNFαinduced muscle wasting in an NF-κB-dependent and IL-6-independent manner. EMBO Mol Med. 2017; 9: 622-637.
- Jimenez-Gutierrez GE, Martínez-Gómez LE, Martínez-Armenta C, et al. Molecular mechanisms of inflammation in sarcopenia: diagnosis and therapeutic update. Cells. 2022; 11: 2359.
- Rong YD, Bian AL, Hu HY, Ma Y, Zhou XZ. Study on relationship between elderly sarcopenia and inflammatory cytokine IL-6, anti-inflammatory cytokine IL-10. BMC Geriatr. 2018; 18: 308.
- Torres-Ruiz J, Alcalá-Carmona B, Alejandre-Aguilar R, et al. Inflammatory myopathies and beyond: the dual role of neutrophils in muscle damage and regeneration. Front Immunol. 2023; 14: 1113214.
- Guo B, Liu X, Si Q, et al. Associations of CBC-derived inflammatory indicators with sarcopenia and mortality in adults: evidence from NHANES 1999–2006. BMC Geriatr. 2024; 24: 432.
- Da Boit M, Sibson R, Sivasubramaniam S, et al. Sex differences in the effect of fish-oil supplementation on the adaptive response to resistance exercise training in older people: a randomized controlled trial. Am J Clin Nutr. 2017; 105: 151-158.
- Zhu LY, Chan R, Kwok T, et al. Effects of exercise and nutrition supplementation in community-dwelling older Chinese people with sarcopenia: a randomized controlled trial. Age Ageing. 2019; 48: 220-228.
- Ganapathy A, Nieves JW. Nutrition and sarcopenia—what do we know? Nutrients. 2020; 12: 1755.
- Keller U. Nutritional laboratory markers in malnutrition. J Clin Med. 2019; 8: 775.
- Loban A, Kime R, Powers H. Iron-binding antioxidant potential of plasma albumin. Clin Sci. 1997; 93: 445-451.
- Cantin AM, Paquette B, Richter M, Larivée P. Albumin-mediated regulation of cellular glutathione and nuclear factor kappa B activation. Am J Respir Crit Care Med. 2000; 162: 1539-1546.
- Pansarasa O, Castagna L, Colombi B, et al. Age and sex differences in human skeletal muscle: role of reactive oxygen species. Free Radic Res. 2000; 33: 287-293.
- Influence of some biological indexes on sex hormone-binding globulin and androgen levels in aging or obese males.
- Jones DT, Ganeshaguru K, Anderson RJ, et al. Albumin activates the AKT signaling pathway and protects B-chronic lymphocytic leukemia cells from chlorambuciland radiation-induced apoptosis. Blood. 2003; 101: 3174-3180.
- Kim H, Suzuki T, Kim M, et al. Incidence and predictors of sarcopenia onset in community-dwelling elderly Japanese women: 4-year follow-up study. J Am Med Dir Assoc. 2015; 16: 85.e1-85. e8.
- Erdoğan K, Kara M, Şener FE, et al. Serum albumin as a biomarker of nutritional status in sarcopenia. J Bone Miner Metab. 2024.
- Shen G, Liu Y, Zhou C, et al. Associations between neutrophilpercentage-to-albumin ratio level and all-cause mortality and cardiovascular disease-cause mortality in diabetes population. BMC Public Health. 2025; 25: 401.
- Li Y, Yu C. Correlation between neutrophil percentage-to-albumin ratio and all-cause and cerebrovascular mortality among hypertension patients. Sci Rep. 2025; 15: 2989.
- Li X, Wu M, Chen M, et al. The association between neutrophilpercentage-to-albumin ratio and mortality among individuals with cancer: insights from National Health and Nutrition Examination Survey. Cancer Med. 2025; 14: e70527.
- Karaca M, Gumusdag A. Prognostic role of neutrophil percentage-to-albumin ratio in patients with non-ST-elevation myocardial infarction. Medicina. 2024; 60: 2101.
- Wang J, Shen Z, Liang Y, et al. Association of neutrophil percentage to albumin ratio with gallstones: a cross-sectional study from the United States NHANES. BMC Public Health. 2024; 24: 3503.
- Wang L, Liu L, Liu X, Yang L. The association between neutrophil percentage-to-albumin ratio and depression among US adults: a cross-sectional study. Sci Rep. 2024; 14: 21880.
- Swan L, Warters A, O’Sullivan M. Socioeconomic disadvantage is associated with probable sarcopenia in community-dwelling older adults: findings from the English Longitudinal Study of Ageing. J Frailty Aging. 2022; 11: 398-406.
- Swan L, Warters A, O’Sullivan M. Socioeconomic inequality and risk of sarcopenia in community-dwelling older adults. Clin Interv Aging. 2021; 16: 1119-1129.
- Dorosty A, Arero G, Chamar M, Tavakoli S. Prevalence of sarcopenia and its association with socioeconomic status among the elderly in Tehran. Ethiop J Health Sci. 2016; 26: 389.
- Mo Y, Zhou Y, Chan H, et al. The association between sedentary behaviour and sarcopenia in older adults: a systematic review and meta-analysis. BMC Geriatr. 2023; 23: 877.
- Hwang J, Park S. Sex differences of sarcopenia in an elderly Asian population: the prevalence and risk factors. Int J Environ Res Public Health. 2022; 19: 11980.
- Du Y, Wang X, Xie H, et al. Sex differences in the prevalence and adverse outcomes of sarcopenia and sarcopenic obesity in community dwelling elderly in East China using the AWGS criteria. BMC Endocr Disord. 2019; 19: 109.
- Hai S, Wang H, Cao L, et al. Association between sarcopenia with lifestyle and family function among community-dwelling Chinese aged 60 years and older. BMC Geriatr. 2017; 17: 187.
- Hsu CI, Wei J, Tung HH, et al. Malnutrition, family support, and possible sarcopenia in patients undergoing transcatheter aortic valve implantation. J Cardiovasc Nurs. 2021; 36: 565-572.
- Gao Q, Hu K, Yan C, et al. Associated factors of sarcopenia in community-dwelling older adults: a systematic review and meta-analysis. Nutrients. 2021; 13: 4291.
- Benz E, Trajanoska K, Lahousse L, et al. Sarcopenia in COPD: a systematic review and meta-analysis. Eur Respir Rev. 2019; 28: 190049.
- Sepúlveda-Loyola W, Osadnik C, Phu S, et al. Diagnosis, prevalence, and clinical impact of sarcopenia in COPD: a systematic review and meta-analysis. J Cachexia Sarcopenia Muscle. 2020; 11: 1164-1176.